You would use standard multiple regression in which gender and weight were the independent variables and height was the dependent variable. First, it would tell you how much of the variance of height was accounted for by the joint predictive power of knowing a person’s weight and gender. The output would also tell you if the model allows you to predict a person’s height at a rate better than chance.
There are two types of linear regression, simple linear regression and multiple linear regression. Regression analysis in business is a statistical technique used to find the relations between two or more variables. In regression analysis one variable is independent and its impact on the other dependent variables is measured. When there is only one dependent and independent variable we call is simple regression. On the other hand, when there are many independent variables influencing one dependent variable we call it multiple regression.
Checking the quality of regression models
Usually, regression analysis is used with naturally-occurring variables, as opposed to experimentally manipulated variables, although you can use regression with experimentally manipulated variables. One point to keep in mind with regression analysis is that causal relationships among the variables cannot be determined. While the terminology is such that we say that X “predicts” Y, we cannot say that X “causes” Y.
You need to have several times as many observations as you have independent variables, otherwise you can get “overfitting”—it could look like every independent variable is important, even if they’re not. A common rule of thumb is that you should have at least 10 to 20 times as many observations as you have independent variables. You’ll probably just want to collect as much data as you can afford, but if you really need to figure out how to do a formal power analysis for multiple regression, Kelley and Maxwell is a good place to start. It is easy to throw a big data set at a multiple regression and get an impressive-looking output. However, many people are skeptical of the usefulness of multiple regression, especially for variable selection.
If the significance level is between .05 and .10, then the model is considered marginal. In other words, the model is fairly good at predicting a person’s height, but there is between a 5-10% probability that there really is not a relationship between height and weight and gender. You’re probably familiar with plotting line graphs with one X axis and one Y axis. The X variable is sometimes called the independent variable and the Y variable is called the dependent variable.
What is Linear Regression?
For ordinal variables with more than two values, there are the ordered logit and ordered probit models. Censored regression models may be used when the dependent variable is only sometimes observed, and Heckman correction type models may be used when the sample is not randomly selected from the population of interest. An alternative to such procedures is linear regression based on polychoric correlation (or polyserial correlations) between the categorical variables. Such procedures differ in the assumptions made about the distribution of the variables in the population. If the variable is positive with low values and represents the repetition of the occurrence of an event, then count models like the Poisson regression or the negative binomial model may be used.
So you might conclude that height is highly influential on vertical leap, while arm length is unimportant. However, this result would be very unstable; adding just one more observation could tip the balance, so that now the best equation had arm length but not height, and you could conclude that height has little effect on vertical leap. The response variable may be non-continuous (“limited” to lie on some subset of the real line).
The two basic types of regression are simple linear regression and multiple linear regression, although there are non-linear regression methods for more complicated data and analysis. Simple linear regression uses one independent variable to explain or predict the outcome of the dependent variable Y, while multiple linear regression uses two or more independent variables to predict the outcome.
Simple linear regression is similar to correlation in that the purpose is to measure to what extent there is a linear relationship between two variables. The major difference between the two is that correlation makes no distinction between independent and dependent variables while linear regression does.
This means that different researchers, using the same data, could come up with different results based on their biases, preconceived notions, and guesses; many people would be upset by this subjectivity. Whether you use an objective approach like stepwise multiple regression, or a subjective model-building approach, you should treat multiple regression as a way of suggesting patterns in your data, rather than rigorous hypothesis testing.
Inmultiple linear regression two or more independent variables are used to predict the value of a dependent variable. The difference between the two is the number of independent variables. If the multiple regression equation ends up with only two independent variables, you might be able to draw a three-dimensional graph of the relationship.
Multiple regression is used to examine the relationship between several independent variables and a dependent variable. IntroductionRegression analysis is used when you want to predict a continuous dependent variable from a number of independent variables. If the dependent variable is dichotomous, then logistic regression should be used. (If the split between the two levels of the dependent variable is close to 50-50, then both logistic and linear regression will end up giving you similar results.) The independent variables used in regression can be either continuous or dichotomous. Independent variables with more than two levels can also be used in regression analyses, but they first must be converted into variables that have only two levels.
- For specific mathematical reasons (see linear regression), this allows the researcher to estimate the conditional expectation (or population average value) of the dependent variable when the independent variables take on a given set of values.
- For example, the method of ordinary least squares computes the unique line (or hyperplane) that minimizes the sum of squared distances between the true data and that line (or hyperplane).
- The most common form of regression analysis is linear regression, in which a researcher finds the line (or a more complex linear combination) that most closely fits the data according to a specific mathematical criterion.
You continue this until adding new X variables does not significantly increase R2 and removing X variables does not significantly decrease it. Atlantic beach tiger beetle, Cicindela dorsalis dorsalis.One use of multiple regression is prediction or estimation of an unknown Y value corresponding to a set of X values. For example, let’s say you’re interested in finding suitable habitat to reintroduce the rare beach tiger beetle, Cicindela dorsalis dorsalis, which lives on sandy beaches on the Atlantic coast of North America. Multiple regression would give you an equation that would relate the tiger beetle density to a function of all the other variables. This could help you guide your conservation efforts, so you don’t waste resources introducing tiger beetles to beaches that won’t support very many of them.
For specific mathematical reasons (see linear regression), this allows the researcher to estimate the conditional expectation (or population average value) of the dependent variable when the independent variables take on a given set of values. As mentioned, the significance levels given for each independent variable indicates whether that particular independent variable is a significant predictor of the dependent variable, over and above the other independent variables.
Standard multiple regression is the same idea as simple linear regression, except now you have several independent variables predicting the dependent variable. To continue with the previous example, imagine that you now wanted to predict a person’s height from the gender of the person and from the weight.
Another assumption of multiple regression is that the X variables are not multicollinear. Multicollinearity occurs when two independent variables are highly correlated with each other. For example, let’s say you included both height and arm length as independent variables in a multiple regression with vertical leap as the dependent variable. Because height and arm length are highly correlated with each other, having both height and arm length in your multiple regression equation may only slightly improve the R2 over an equation with just height.
What is Simple Linear Regression?
Simple linear regression plots one independent variable X against one dependent variable Y. Technically, in regression analysis, the independent variable is usually called the predictor variable and the dependent variable is called the criterion variable. However, many people just call them the independent and dependent variables. More advanced regression techniques (like multiple regression) use multiple independent variables. It is used to determine the extent to which there is a linear relationship between a dependent variable and one or more independent variables.
If your goal is prediction, multicollinearity isn’t that important; you’d get just about the same predicted Y values, whether you used height or arm length in your equation. However, if your goal is understanding causes, multicollinearity can confuse you. Before doing multiple regression, you should check the correlation between each pair of independent variables, and if two are highly correlated, you may want to pick just one.
In particular, the purpose of linear regression is to “predict” the value of the dependent variable based upon the values of one or more independent variables. In simple linear regression a single independent variable is used to predict the value of a dependent variable.
Find a Linear Regression Equation in Excel
What is meant by simple regression?
1. simple regression – the relation between selected values of x and observed values of y (from which the most probable value of y can be predicted for any value of x) regression toward the mean, statistical regression, regression.
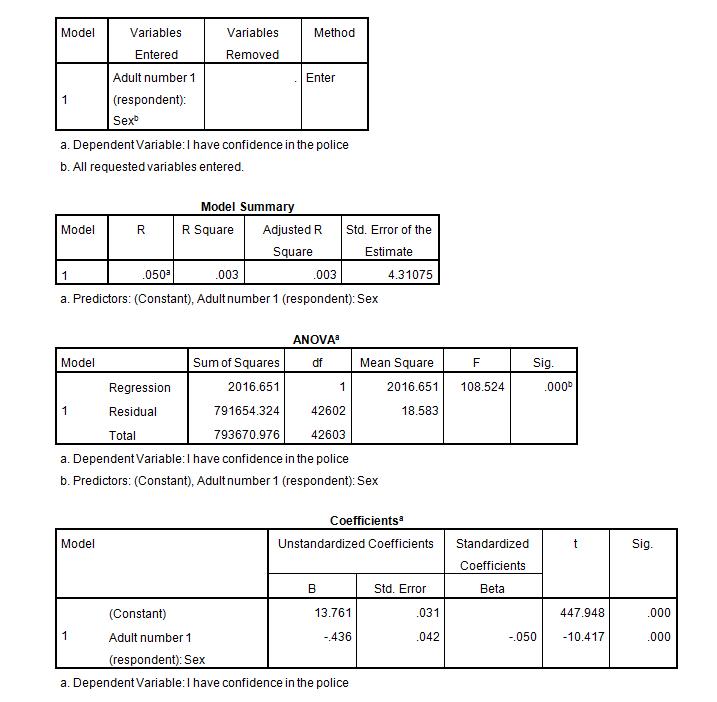
This is denoted by the significance level of the overall F of the model. If the significance is .05 (or less), then the model is considered significant. In other words, there is only a 5 in a 100 chance (or less) that there really is not a relationship between height and weight and gender. For whatever reason, within the social sciences, a significance level of .05 is often considered the standard for what is acceptable.
This could happen because the variance that the first independent variable shares with the dependent variable could overlap with the variance that is shared between the second independent variable and the dependent variable. Consequently, the first independent variable is no longer uniquely predictive and thus would not show up as being significant in the multiple regression. Because of this, it is possible to get a highly significant R2, but have none of the independent variables be significant.
You could add variables X1, X2, X3, and X4, with a significant increase in R2 at each step, then find that once you’ve added X3 and X4, you can remove X1 with little decrease in R2. It is even possible to do multiple regression with independent variables A, B, C, and D, and have forward selection choose variables A and B, and backward elimination choose variables C and D. To do stepwise multiple regression, you add X variables as with forward selection. Each time you add an X variable to the equation, you test the effects of removing any of the other X variables that are already in your equation, and remove those if removal does not make the equation significantly worse.
For binary (zero or one) variables, if analysis proceeds with least-squares linear regression, the model is called the linear probability model. Nonlinear models for binary dependent variables include the probit and logit model. The multivariate probit model is a standard method of estimating a joint relationship between several binary dependent variables and some independent variables. For categorical variables with more than two values there is the multinomial logit.
Linear Regression: Simple Steps, Video. Find Equation, Coefficient, Slope
The most common form of regression analysis is linear regression, in which a researcher finds the line (or a more complex linear combination) that most closely fits the data according to a specific mathematical criterion. For example, the method of ordinary least squares computes the unique line (or hyperplane) that minimizes the sum of squared distances between the true data and that line (or hyperplane).