This can be illustrated by graphing the short run total cost curve and the short-run variable cost curve. Each curve initially increases at a decreasing rate, reaches an inflection point, then increases at an increasing rate.
A change in fixed cost would have no effect on the position or shape of these curves. The intersection of MR and MC is shown in the next diagram as point A.
For instance, taking the first definition, if it costs a firm $400 to produce 5 units and $480 to produce 6, the marginal cost of the sixth unit is 80 dollars. This is because the market dictates the optimal price level and companies do not have much – if any – discretion over the price. As a result, perfectly competitive firms maximize profits when marginal costs equal market price, and marginal revenue. For a monopolist, the marginal benefit of selling an additional unit is less than the market price.
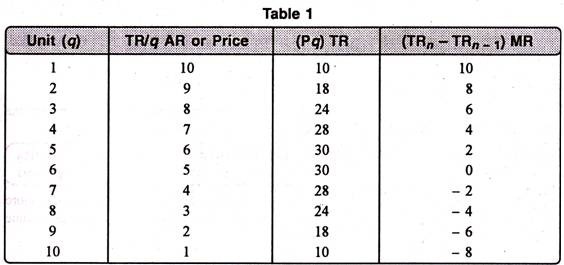
Marginal Revenue (MR)
Economies of scale apply to the long run, a span of time in which all inputs can be varied by the firm so that there are no fixed inputs or fixed costs. Production may be subject to economies of scale (or diseconomies of scale). Economies of scale are said to exist if an additional unit of output can be produced for less than the average of all previous units – that is, if long-run marginal cost is below long-run average cost, so the latter is falling. Conversely, there may be levels of production where marginal cost is higher than average cost, and the average cost is an increasing function of output.
Competitive Firms vs. Monopolies
There would be no effect on the total revenue curve or the shape of the total cost curve. This point can also be illustrated using the diagram for the marginal revenue–marginal cost perspective.
Since fixed costs do not vary with (depend on) changes in quantity, MC isVCQ. Thus if fixed cost were to double, the marginal cost MC would not be affected, and consequently, the profit-maximizing quantity and price would not change.
Where there are economies of scale, prices set at marginal cost will fail to cover total costs, thus requiring a subsidy. For this generic case, minimum average cost occurs at the point where average cost and marginal cost are equal (when plotted, the marginal cost curve intersects the average cost curve from below). In economics, marginal cost is the change in the total cost that arises when the quantity produced is incremented by one unit; that is, it is the cost of producing one more unit of a good. Intuitively, marginal cost at each level of production includes the cost of any additional inputs required to produce the next unit.
Any such change would have no effect on the shape of the SRVC curve and therefore its slope MC at any point. In perfectly competitive markets, firms decide the quantity to be produced based on marginal costs and sale price.
What is the best definition of marginal revenue?
Revenue is the total amount producers receive after selling a good. Marginal cost is the money paid for producing one more unit of a good. Marginal revenue is the money earned from selling one more unit of a good.
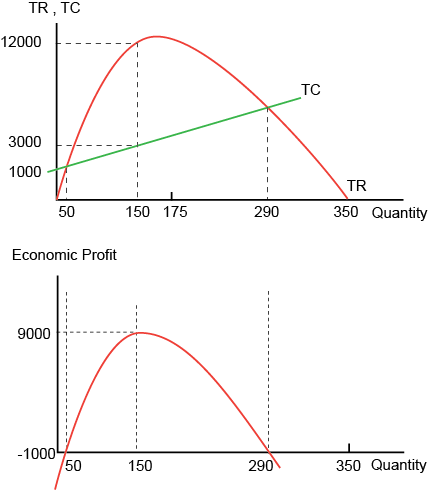
Using the diagram illustrating the total cost–total revenue perspective, the firm maximizes profit at the point where the slopes of the total cost line and total revenue line are equal. An increase in fixed cost would cause the total cost curve to shift up rigidly by the amount of the change.
- Economies of scale apply to the long run, a span of time in which all inputs can be varied by the firm so that there are no fixed inputs or fixed costs.
- Production may be subject to economies of scale (or diseconomies of scale).
If the industry is perfectly competitive (as is assumed in the diagram), the firm faces a demand curve (D) that is identical to its marginal revenue curve (MR), and this is a horizontal line at a price determined by industry supply and demand. Total economic profit is represented by the area of the rectangle PABC. The optimum quantity (Q) is the same as the optimum quantity in the first diagram. Long run costs are accumulated when firms change production levels over time in response to expected economic profits or losses.

The illustration also shows the relationship between a monopolist’s demand and marginal revenue. Remember that marginal revenue is the change in total revenue that occurs when one additional unit of a good is produced and sold. Because the monopolist’s demand curve is identical to the market demand curve, the monopolist can sell an additional unit of output only by lowering the product’s price. If the price does not cover average variable costs, the firm prefers to shut down. In other words, if the total revenue (total sale proceeds) does not include total variable costs, the business must shut down.
A firm maximizes profit by operating where marginal revenue equals marginal cost. In the short run, a change in fixed costs has no effect on the profit maximizing output or price. The firm merely treats short term fixed costs as sunk costs and continues to operate as before.
What is marginal revenue example?
A company calculates marginal revenue by dividing the change in total revenue by the change in total output quantity. For example, a company sells its first 100 items for a total of $1,000. If it sells the next item for $8, the marginal revenue of the 101st item is $8.
The only difference between the curves is that the SRVC curve begins from the origin while the SRTC curve originates on the positive part of the vertical axis. The distance of the beginning point of the SRTC above the origin represents the fixed cost – the vertical distance between the curves. This distance remains constant as the quantity produced, Q, increases. A change in fixed cost would be reflected by a change in the vertical distance between the SRTC and SRVC curve.
What Factors Influence Competition in Microeconomics?
The land, labor, capital goods, and entrepreneurship all vary to reach the the long run cost of producing a good or service. They analyze the current and projected state of the market in order to make production decisions. Efficient long run costs are sustained when the combination of outputs that a firm produces results in the desired quantity of the goods at the lowest possible cost. Examples of long run decisions that impact a firm’s costs include changing the quantity of production, decreasing or expanding a company, and entering or leaving a market.
If the sale price is higher than the marginal cost, then they produce the unit and supply it. If the marginal cost is higher than the price, it would not be profitable to produce it. So the production will be carried out until the marginal cost is equal to the sale price.
At each level of production and time period being considered, marginal costs include all costs that vary with the level of production, whereas other costs that do not vary with production are fixed and thus have no marginal cost. For example, the marginal cost of producing an automobile will generally include the costs of labor and parts needed for the additional automobile but not the fixed costs of the factory that have already been incurred. In practice, marginal analysis is segregated into short and long-run cases, so that, over the long run, all costs (including fixed costs) become marginal.
It will produce something only when the price covers the average variable cost and part of the average fixed costs. The output at which marginal cost is equal to marginal revenue keeps losses minimum. The same is likewise true of the long run equilibria of monopolistically competitive industries and, more generally, any market which is held to be contestable. Normally, a firm that introduces a differentiated product can initially secure a temporary market power for a short while (See “Persistence” in Monopoly Profit).